The US Poison Control Centers’ National Poison Data System (NPDS) publishes annual reports describing exposures to various substances among the general population.1 Table 22B of each NPDS report shows the number of outcomes from exposures to different pharmacologic treatments in the United States, including psychotropic medications.2 In this Table, the relative morbidity (RM) of a medication is calculated as the ratio of serious outcomes (SO) to single exposures (SE), where SO = moderate + major + death. In this article, I use the NPDS data to demonstrate how time series analysis of the RM ratios for hypertension and psychiatric medications can help predict SO associated with these agents, which may help guide clinicians’ prescribing decisions.2,3
Time series analysis of hypertension medications
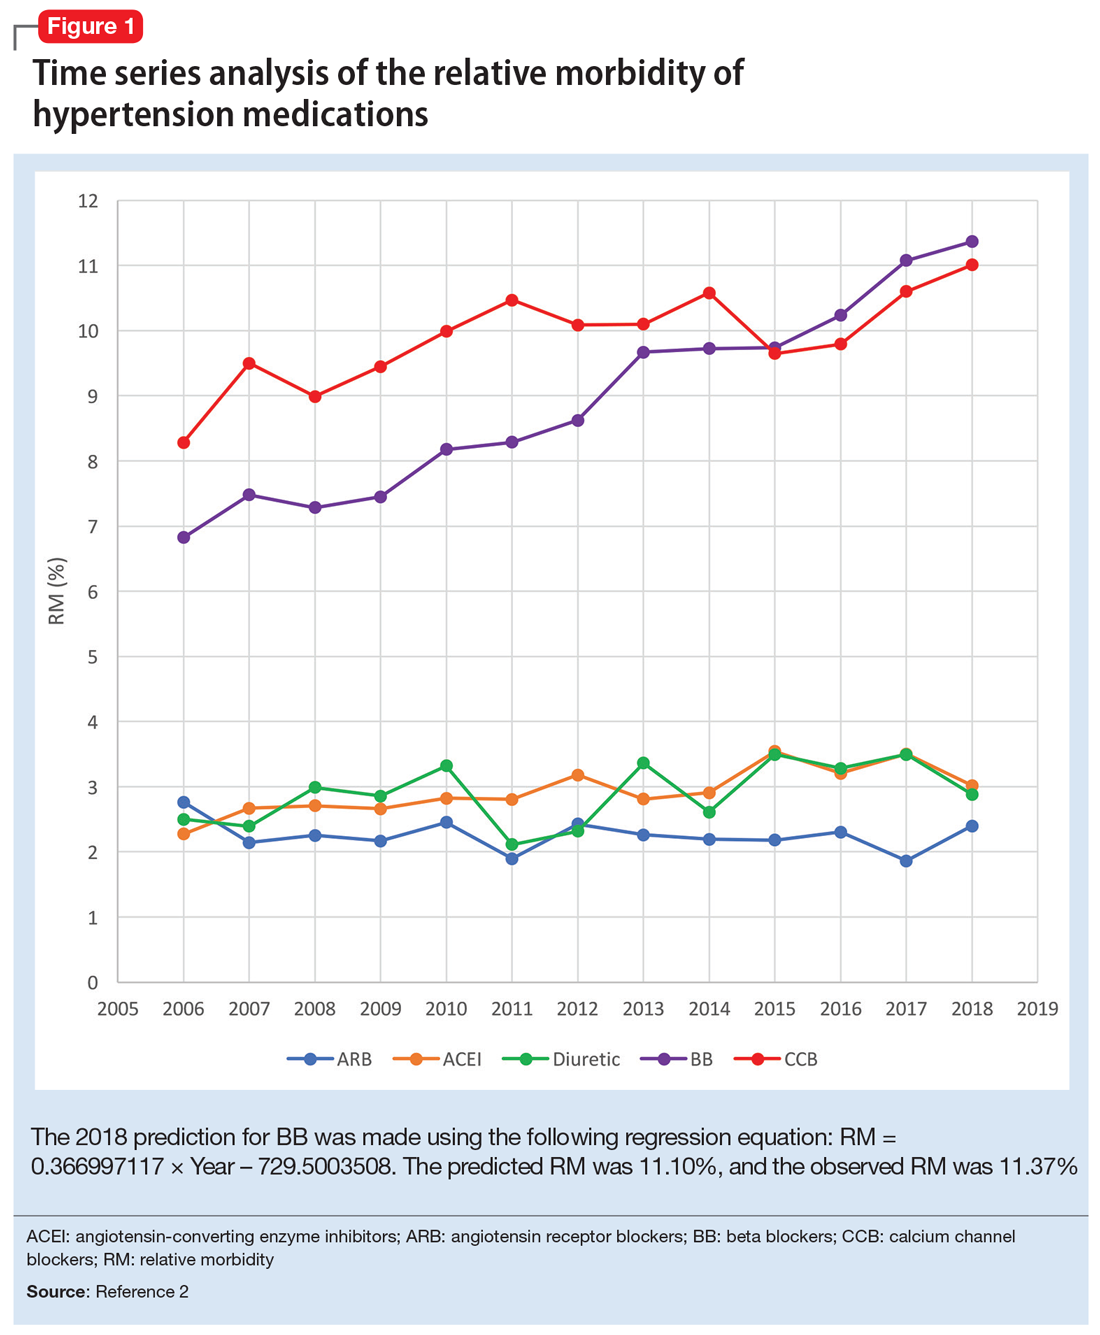
Due to the high prevalence of hypertension, it is not surprising that more suicide deaths occur each year from calcium channel blockers (CCB) than from lithium (37 vs 2, according to 2017 NPDS data).3 I used time series analysis to compare SO during 2006-2017 for 5 classes of hypertension medications: CCB, beta blockers (BB), angiotensin-converting enzyme inhibitors (ACEI), angiotensin receptor blockers (ARB), and diuretics (Figure 1).
Time series analysis of 2006-2017 data predicted the following number of deaths for 2018: CCB ≥33, BB ≥17, ACEI ≤2, ARB 0, and diuretics ≤1. The observed deaths in 2018 were 41, 23, 0, 0, and 1, respectively.2 The 2018 predicted RM were CCB 10.66%, BB 11.10%, ACEI 3.51%, ARB 2.04%, and diuretics 3.38%. The 2018 observed RM for these medications were 11.01%, 11.37%, 3.02%, 2.40%, and 2.88%, respectively.2
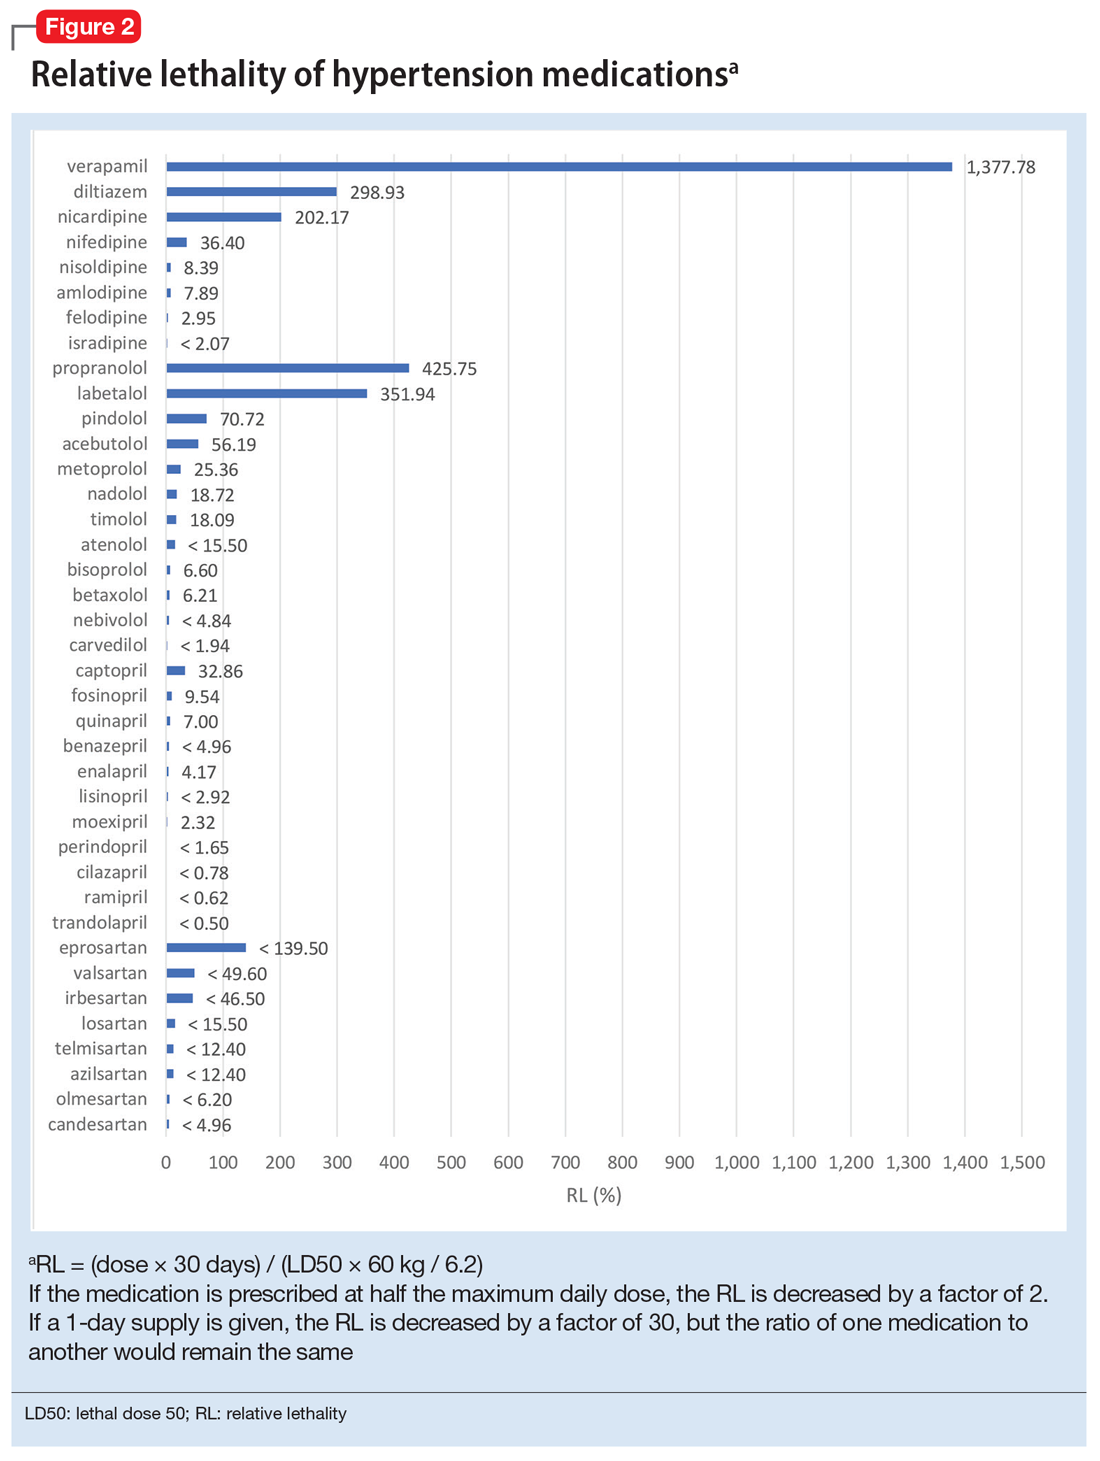
Because the NPDS data for hypertension medications was only provided by class, in order to detect differences within each class, I used the relative lethality (RL) equation: RL = 310x / LD50, where x is the maximum daily dose of a medication prescribed for 30 days, and LD50 is the rat oral lethal dose 50. The RL equation represents the ratio of a 30-day supply of medication to the human equivalent LD50 for a 60-kg person.4 The RL equation is useful for comparing the safety of various medications, and can help clinicians avoid prescribing a lethal amount of a given medication (Figure 2). For example, the equation shows that among CCB, felodipine is 466 times safer than verapamil and 101 times safer than diltiazem. Not surprisingly, 2006-2018 data shows many deaths via intentional verapamil or diltiazem overdose vs only 1 reference to felodipine. A regression model shows significant correlation and causality between RL and SO over time.5 Integrating all 3 mathematical models suggests that the higher RM of CCB and BB may be caused by the high RL of verapamil, diltiazem, nicardipine, propranolol, and labetalol.
These mathematical models can help physicians consider whether to switch the patient’s current medication to another class with a lower RM. For patients who need a BB or CCB, prescribing a medication with a lower RL within the same class may be another option. The data suggest that avoiding hypertension medications with RL >100% may significantly decrease morbidity and mortality.
Predicting serious outcomes of psychiatric medications
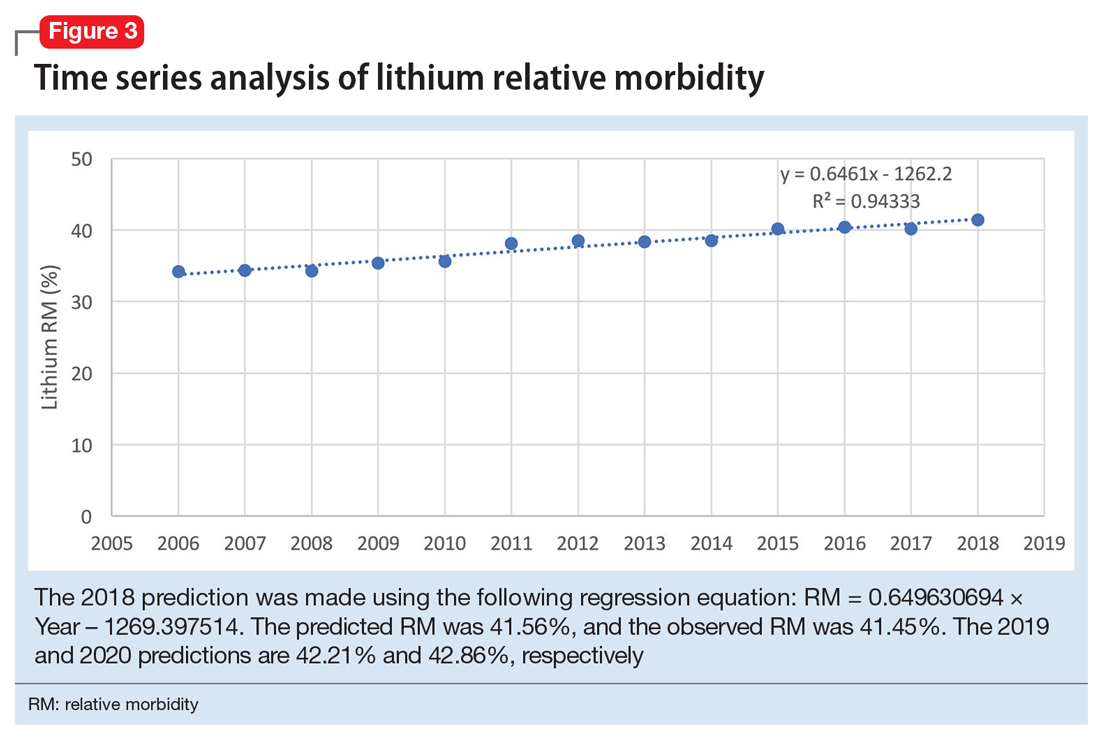
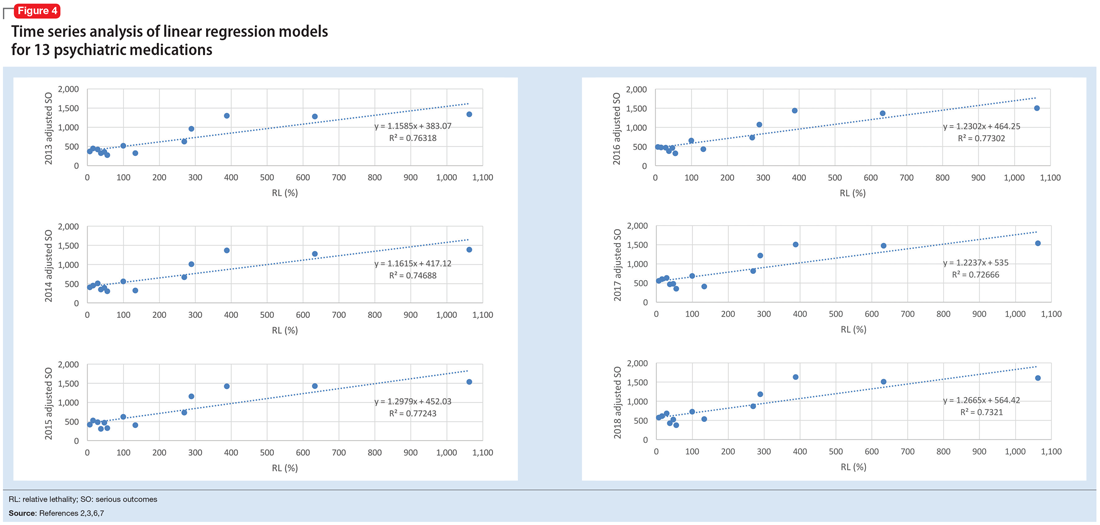
The 2018 NPDS data for psychiatric medications show similarly important results.2 For example, the lithium RM is predictable over time (Figure 3) and has been consistently the highest among psychiatric medications. Using 2006-2017 NPDS data,3 I predicted that the 2018 lithium RM would be 41.56%. The 2018 observed lithium RM was 41.45%.2 I created a linear regression model for each NPDS report from 2013 to 2018 to illustrate the correlation between RL and adjusted SO for 13 psychiatric medications.2,3,6,7 To account for different sample sizes among medications, the lithium SE for each respective year was used for all medications (adjusted SO = SE × RM). A time series analysis of these regression models shows that SO data points hover in the same y-axis region from year to year, with a corresponding RL on the x-axis: escitalopram 6.33%, citalopram 15.50%, mirtazapine 28.47%, paroxetine 37.35%, sertraline 46.72%, fluoxetine 54.87%, venlafaxine 99.64%, duloxetine 133.33%, trazodone 269.57%, bupropion 289.42%, amitriptyline 387.50%, doxepin 632.65%, and lithium 1062.86% (Figure 4). Every year, the scatter plot shape remains approximately the same, which suggests that both SO and RM can be predicted over time. Medications with RL >300% have SO ≈ 1500 (RM ≈ 40%), and those with RL <100% have SO ≈ 500 (RM ≈ 13%).
Time series analysis of NPDS data sheds light on hidden patterns. It may help clinicians discern patterns of potential SO associated with various hypertension and psychiatric medications. RL based on rat experimental data is highly correlated to RM based on human observational data, and the causality is self-evident. On a global scale, data-driven prescribing of medications with RL <100% could potentially help prevent millions of SO every year.


